
Getting to the Root of Slow Page Loads: Our Database Optimization Story

Imagine your customers are complaining that a few specific pages in your application take forever to load and you get to work to fix the issues. But there is a problem. You don’t know where to begin. If this journey of seeking truth, I mean answers, interests you, then read the rest of the article.
Recently I was facing a similar challenge. I had to understand and fix the problems that were causing slowness on a few pages of a product. To give some technical context on the product, it was running on Rails 7.1 and using Postgres 13.0 as the database of choice. For the purpose of this article, let us assume that we are working on this together. So we have narrowed down the pages that we want to fix the performance for. The next step is to figure out where to begin. The pages can be slow due to various reasons like javascript and css bloat, slow database queries, high request queue, etc.
rack-mini-profiler
The first step in this journey is to integrate rack-mini-profiler . This gem will help us see insights about the page and the time it spent on different steps to load the page, so we don’t have to guess that.
Here is a screenshot of what that data can look like:
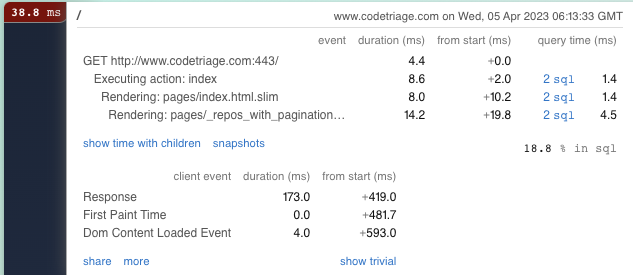
As you can see from the screenshot, it gives us information about all the database queries that were fired on the page. We can click on those mysql query links and get more information like what query is that, how much time it took, what line in the application code triggers the query. It also gives us information about the various partials that were rendered as part of the page, and how much time each partial took. In which component of the page was the majority percentage of time spent?
For the purpose of this article, let us assume that the majority of the page load time was spent in the sql queries. So by using rack-mini-profiler, we were able to narrow down to the problem that was leading to high page load times and also the queries which took the most time.
Analyzing the slow queries
Once we know which queries to debug, we are one step closer to a better performing page. A query could be slow due to various reasons like lack of or wrong indexing, fetching extra columns, lack of joins, etc. One of the most common reasons which hurts the most is lack of or wrong indexing.
But how do we even find out what are these indexes and which ones are being used or simply put, how do we know how the database is running a query? The answer to these questions lies in query plans. We can use explain or explain and analyze on the query.
This is how to run the commands from the psql terminal:
explain select * from users limit 1;

explain analyze select * from users limit 1;
The query plan for this query looks like this:
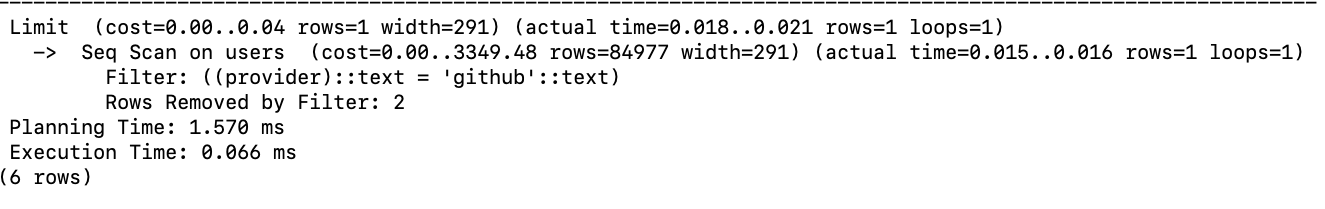
The query plans give us information about what kind of scanning the database had to do to fetch the right data. In this case, the database performed a sequential scan on the users table. We can see the associated cost of performing an index scan. If it was using any index, it would show that in the query plan.
When we see that the query is doing a sequential scan, and then filtering on a column, it nudges us to try and add an index to the table on that column, in this case, index on the provider column of the users table. Once we add the index, we should run the explain analyze command on the query again to see what kind of difference it makes. We should benchmark queries before and after applying optimisations.
Also when I look at the query:
explain select * from users limit 1;
I wonder, do we need all the fields from the users table? This is another area we should look into when we are debugging queries. The less data points we fetch, the faster we will get the query results.
But there is a big problem that lies ahead of us. Let us assume that we added the index on provider to the users table and we ran the query again. Upon running it with explain analyze, we see that it is still doing a sequential scan and not using the newly created index. What does this mean? This brings us to the next section.
Test data
Using rack-mini-profiler in the earlier section, we had narrowed down the slow queries. But when I ran these queries in our local environment, we realised that they are not slow at all. When we are running these queries, and running explain analyze on them, we do not see a high associated cost in running the query, even the sequential scans are fast.
Sometimes, when the data in the table is too small, then doing a sequential scan is faster than looking for that data in the index and then fetching those selected rows from the table.
rack-mini-profiler was being run on the production application, while the same queries and pages are not slow in our local environment. One of the reasons for this is because the database and the data in it are not of similar scale when compared with the production environment. Then, how do we solve this problem?
One way is to take a database dump from the production environment and restore that dump locally. This way we can at least work on the same amount of data. The server configuration still remains widely different from what we have running on production, but that seems far-fetched to have the same configuration locally. There is a problem with this though. What if the database on production is too big to download and restore locally? What if the database contains personal information about the users that we are not allowed to download without their consent? This brings us to the second way.
The second way is to generate fake data locally. For this, we use the faker gem to generate the fake data. But we wonder how much data is enough data to test the slowness in our queries? Sometimes it won’t be possible to generate the same amount of data as there is production. And there is no right answer to how much data is enough. For example, when I first ran the query:
explain select * from users limit 1;
The associated cost was very slow. The total number of records in the users table was 20 at the time. There is just not enough data in the database to perform and benchmark any kind of optimisation.
So I used the faker gem to add 200,000 records in the users table. This is the script I used:
200000**.times do |index|
  u = User.new
  u.email = Faker::Internet.email
  u.provider = 'github'
  u.save
end
And now when I run explain on the select query, I see a much higher associated cost, and applying optimisations shows some change in the performance of those queries. This is one way to generate test data locally.
Database Server configurations
Sometimes we can fix our queries with all the right techniques, and yet we do not see a big improvement in the performance of our queries. One of the reasons for that could be the configurations of the database. To get a view of some of the database settings, we used a gem called pghero to analyze that and also get some of the other additional insights it gives us about our database.
After integrating the gem with our Rails application, it can look like this:
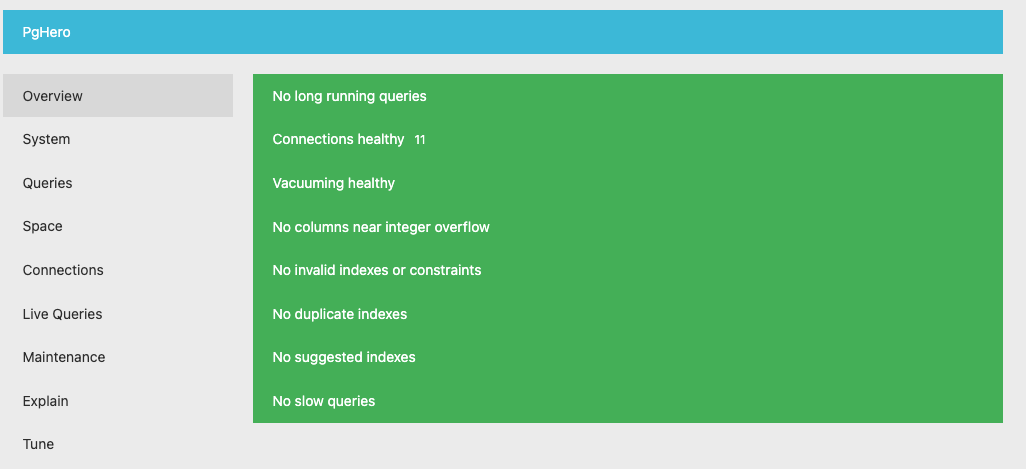
As we can see in the above screenshot, it gives us an overview of our database. It also suggests indexes to apply based on the queries it fires, tracks slow queries for us and more. The tab we are interested in is the tune tab on the left side panel.
This is what it looks like:
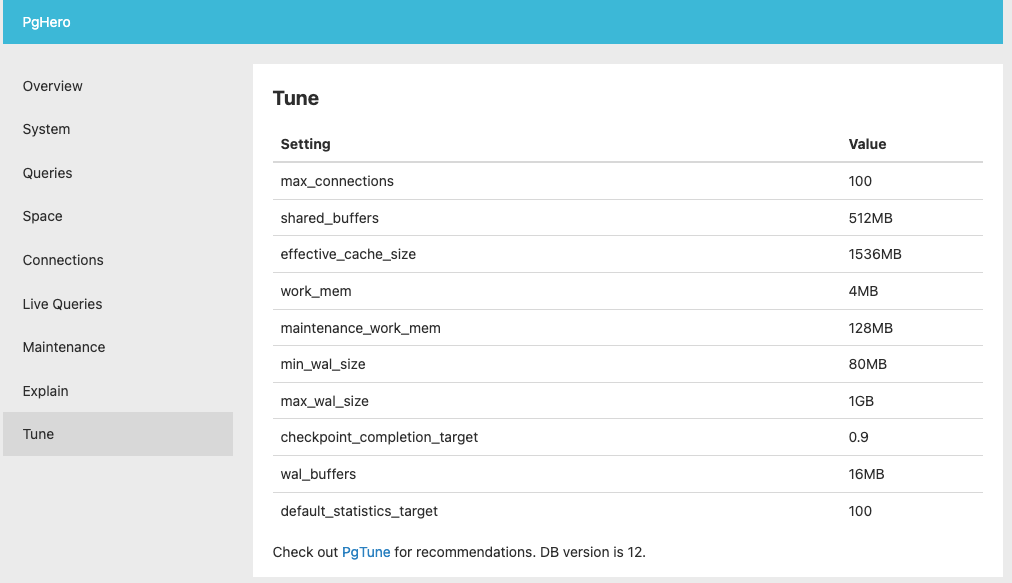
This does not mean the only way to figure out the configuration is to integrate this gem. Another way is to log into the psql terminal and query the pg_settings table. For example, if we want to find the shared_buffers value, we can run this query:
SELECT name, setting::numeric * current_setting('block_size')::numeric AS shared_buffers_bytes
FROM pg_settings                                                                WHERE name = 'shared_buffers';
But by using pghero not only do we get insights on the configuration, but also on various other things like number of connections, CPU load, slow queries, suggested index etc. So we chose to integrate this gem.
Now we have seen the values of various configuration settings, but the next question is, how do we know if these values are what we want or if we should change them to something else? To answer this question, we will use another tool called pgtune . This is what it looks like when we use the tool and fill some information about our database:
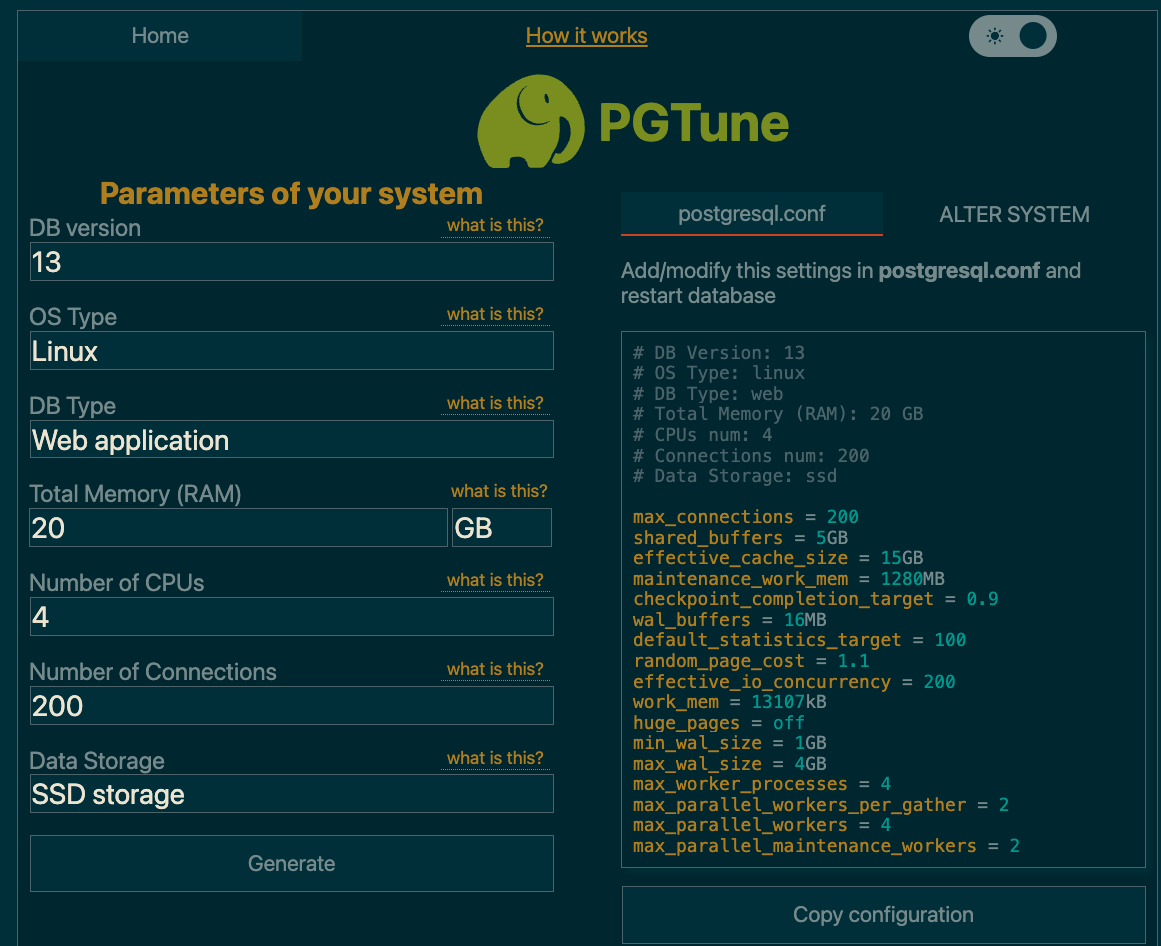
While we are using this tool to get suggestions around various other configuration values for the database, it is always a good idea to read through the database official documentation and find out more about what values should be set in the configuration.
One thing to consider when applying these changes is to first apply them on a staging database instance which is of the same / similar configuration as the production database and benchmark the impact on the staging database.
Conclusion
After applying these configuration changes, and applying the optimisation techniques, we should see an improvement in the page load times for our slow pages. This is how we would approach a problem of high page load times when the bottleneck is the database and the queries.
Having issues with your page load time? Want to optimise your application’s performance? Check out our Tune Report and talk to us today!