
Churn vs. Complexity vs. Code Coverage

Churn vs. Complexity analysis is a great way to find insights about the maintainability of a project. Two of my favorite authors have written great articles about the Churn vs. Complexity graph:
- Getting Empirical about Refactoring by Michael Feathers
- Breaking up the Beheamoth by Sandi Metz
This two-dimensional graph can be very useful in finding the files that are the hardest to maintain in your application. In this article I will explain:
- How you can calculate these metrics and use them in your legacy project
- How code coverage metrics can guide your technical debt’s collection efforts
Churn
Churn by itself is a useful metric. It will tell you which files are the ones that are constantly changing. Change takes time, so files that are constantly changing are costing you time and money.
It will make you wonder:
- Why are these files changing so much?
- Are requirements constantly changing?
- Are we truly understanding business rules correctly?
- Is our application poorly designed?
If your legacy application is written in Ruby, you can use a gem called churn
to find the files that are constantly changing.
Calculating Churn in Ruby
You can install churn like this:
gem install churn
Then call it like this:
churn -e rb --start_date "10 years ago" lib -i spec
This will show you a list of files sorted by their churn count (number of times that the file has changed in the SCM that you are using)
**********************************************************************
* Project Churn
**********************************************************************

Files
+-----------------------------------------------------------------------------------+---------------+
| file_path                                                                         | times_changed |
+-----------------------------------------------------------------------------------+---------------+
| lib/metric_fu.rb                                                                  | 50            |
| lib/metric_fu/version.rb                                                          | 44            |
| lib/metric_fu/configuration.rb                                                    | 36            |
| lib/metric_fu/reporting/templates/awesome/awesome_template.rb                     | 29            |
| lib/metric_fu/io.rb                                                               | 23            |
| lib/metric_fu/formatter/html.rb                                                   | 23            |
| lib/base/configuration.rb                                                         | 23            |
| lib/metric_fu/run.rb                                                              | 22            |
| lib/metric_fu/metrics/saikuro/saikuro.rb                                          | 20            |
| lib/metric_fu/metric.rb                                                           | 20            |
+-----------------------------------------------------------------------------------+---------------+
By itself, this metric provides a limited insight:
These are the files that have changed the most since the beginning of the project
It doesn’t provide insights into why these files are changing as much as they do. If you open these files in your editor, you might find that files with high churn are super complex or super simple.
Complexity
As you go about making your changes, you will introduce complexity. There is no way around it. The best way to have no complexity is to have no code.
It doesn’t matter whether you are a rockstar object-oriented architect or a novice programmer. You will introduce complexity into a project.
“Complexity” should not be considered a negative term. “Unnecessary complexity” might be considered an anti-pattern. Good object-oriented programming calls for loose coupling and high cohesion .
You want modules that follow SOLID principles. When you notice your module is becoming extremely complex, you will want to refactor it into two or more modules. These modules will send and receive messages between each other, which will increase coupling (as loosely as possible) and hopefully improve cohesion per module.
As you go about submitting pull request to ship new features, change existing ones, or patch bugs, the maintainability of your project will vary according to the modules you introduce or change.
The bigger the project, the more complexity, the harder it will be to maintain it, because there will be more moving pieces and loosely coupled modules.
If you refactor a huge module, into two smaller modules, you will notice that cognitive complexity per module will (hopefully) get better. You won’t have one huge, complex module anymore, you will have two or more modules that are easier to understand.
Modules that have one and only one responsibility will be easier to maintain and test. Future changes will be easier because you will be able to quickly understand what the module is doing.
In the next section I will explain how you can calculate complexity for all your Ruby modules.
Calculating Complexity in Ruby
There are many tools out there (e.g. three awesome libraries to assess code quality )
that can help you find the most complex files in your project. One of the most
popular tools in the Ruby world is flog .
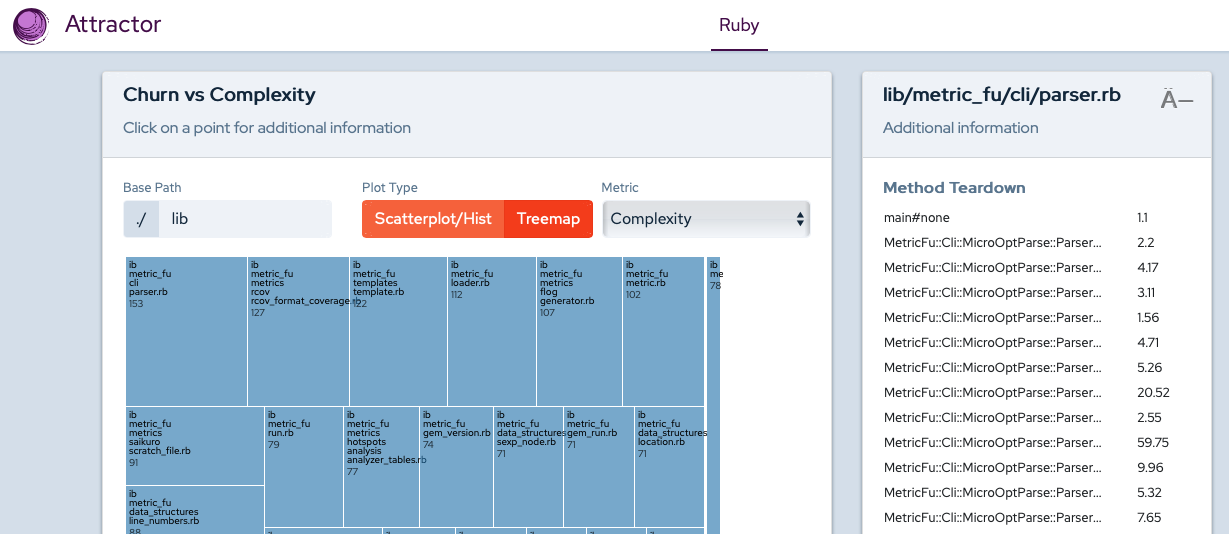
Attractor uses flog to calculate
complexity for each module. I really like the report that it generates. You can
see all the modules in one page:
By itself this metric can take you in the wrong direction. Sometimes you will find extremely complex files which never change. So they are likely not your priority when it’s time to refactor code.
Churn vs. Complexity
In his article, Michael Feathers, states the following:
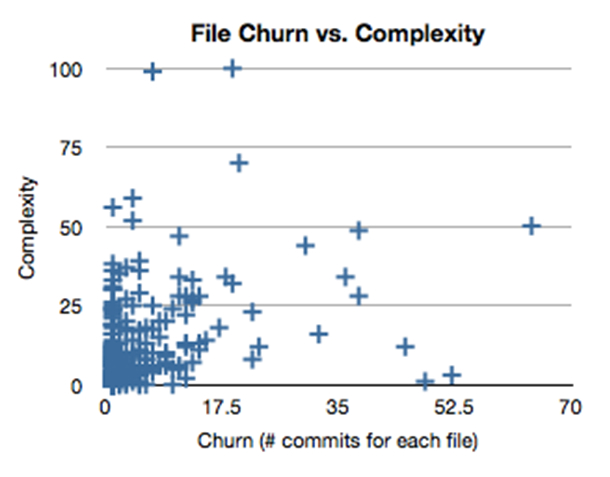
These diagrams give us quite a bit of information. The upper right quadrant is particularly important. These files have a high degree of complexity, and they change quite frequently. […] These classes are particularly ripe for a refactoring investment
I agree that this graph is great for finding refactoring candidates. The problem is that sometimes these candidates have no tests to verify their behavior. So sometimes we don’t have time to:
- Write tests
- Refactor complex files
Sometimes we have to pick one or the other. So in my opinion it would be great to include another metric into our analysis: Code Coverage.
Code Coverage
When we start maintaining a module, we don’t usually just look at its churn and complexity. We also look at the tests that describe its expected behavior.
Usually a module that has a decent test suite (basic code coverage) will be easier to understand than one without tests. We will have one more resource to learn about a module’s behavior.
Code coverage metrics don’t tell whether the test suite is good or bad. It tells you how many statements of your application are exercised by your test suite. You should not blindly trust code coverage percentages without doing a quick code review of the tests that are present.
Don’t you just love it when a module has great tests that describe the expected behavior of its public API?
Churn vs. Complexity vs. Code Coverage
When I look at all the modules in the project, I want to know:
- How many times has this file changed since the beginning of the project? (Churn)
- How complex is this module? (Complexity)
- What’s the code coverage associated with this module? (Code Coverage)
This new dimension will tell us which files are the most changed, the most complicated, and the least covered with tests.
Refactoring modules that lack proper tests can quickly turn into a nightmare. You don’t want your refactoring efforts to blow up in your face when changes hit production. And you probably don’t want to test all your changes manually.
By adding a third dimension to the churn vs complexity graph, you will be able to gather new insights about your modules:
- Should I refactor this module?
- Should I increase test coverage before I refactor this module?
- Do I have time to do both this week?
Calculating a Churn vs. Complexity vs. Code Coverage Graph in Ruby
Last year I published a library that can help you take all these metrics into account: Skunk . It relies on RubyCritic and SimpleCov to get all the metrics it needs.
You can install it like this:
gem install skunk
And run it like this:
skunk lib/
It won’t generate a graph (yet) but it will generate a table with all the modules
in the lib directory. It will sort files from worst to best (in terms of technical
debt):
+-----------------------------------------------------+----------------------------+----------------------------+----------------------------+----------------------------+----------------------------+
| file                                                | skunk_score                | churn_times_cost           | churn                      | cost                       | coverage                   |
+-----------------------------------------------------+----------------------------+----------------------------+----------------------------+----------------------------+----------------------------+
| lib/skunk/cli/commands/default.rb                   | 166.44                     | 1.6643999999999999         | 3                          | 0.5548                     | 0                          |
| lib/skunk/cli/application.rb                        | 139.2                      | 1.392                      | 3                          | 0.46399999999999997        | 0                          |
| lib/skunk/cli/command_factory.rb                    | 97.6                       | 0.976                      | 2                          | 0.488                      | 0                          |
| test/test_helper.rb                                 | 75.2                       | 0.752                      | 2                          | 0.376                      | 0                          |
| lib/skunk/rubycritic/analysed_module.rb             | 48.12                      | 1.7184                     | 2                          | 0.8592                     | 72.72727272727273          |
| test/lib/skunk/cli/commands/status_reporter_test.rb | 45.6                       | 0.456                      | 1                          | 0.456                      | 0                          |
| lib/skunk/cli/commands/base.rb                      | 29.52                      | 0.2952                     | 3                          | 0.0984                     | 0                          |
| lib/skunk/cli/commands/status_reporter.rb           | 8.0                        | 7.9956                     | 3                          | 2.6652                     | 100.0                      |
| test/lib/skunk/rubycritic/analysed_module_test.rb   | 2.63                       | 2.6312                     | 2                          | 1.3156                     | 100.0                      |
+-----------------------------------------------------+----------------------------+----------------------------+----------------------------+----------------------------+----------------------------+
The SkunkScore is a function of complexity and code coverage.
Let’s say that your application has two extremely complex modules: user and product.
Let’s assume that both of them have changed a lot (churn count at 100) and are extremely
complex (1,000 flog points).
In this example, if user has more tests than product, user’s SkunkScore will be
lower than product’s. Next week you could start refactoring user or increasing
code coverage for product
By looking at this table you will be able to quickly decide about what to do: You might want to write tests for a complex module, refactor a complex module that is well covered by integration tests, or both!
Code Coverage as a Prioritization Mechanism
In big projects you might notice hundreds of modules in the upper right quadrant of the Churn vs. Complexity graph. You might ask yourself: What do I do first? Do I write a test for module User? Do I refactor module Product?
I strongly believe that Code Coverage is a great signal for complementing churn and complexity metrics. I hope you can use it in your next legacy project to gradually pay off technical debt!